
How to add charts, maps, and other Extensions
Ask the Agent to add a chart, location map, or photo gallery, then test the result before publishing.
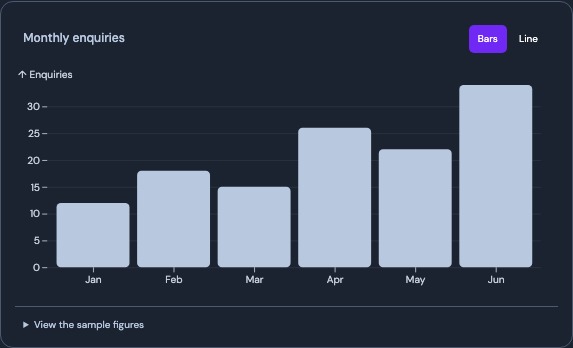
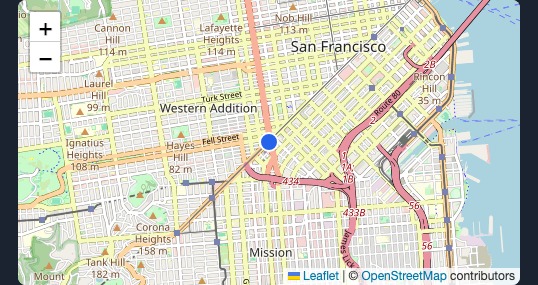
Use an Extension when it helps the visitor understand something on the page. A studio’s contact page might need a map with an accurate entrance. A project page might need photos visitors can enlarge. A chart helps when a table or paragraph would make a comparison hard to see.
1. Collect the information first
For a chart, write down the real values, units, dates, and the point you want to show. For a map, verify the street address and exact pin. For a gallery, choose photos you can publish and write a short description for each. Try the working chart, map, and gallery examples to see how they behave before you choose.
2. Ask for the change on a specific page
Open Edit site and choose the page in Canvas. Name the section, explain what the visitor should do, and give the Agent the content. For the studio, try: “Add a location map below the address on Contact. Put the pin at the customer entrance and leave the address and directions visible above it.”
For a chart, ask the Agent to keep the values available in text or a table. For a gallery, attach the intended photos and ask for useful image descriptions. Use Canvas to select the area you want to change.
3. Test the preview with a real task
Try to find the entrance, read the chart values, or open the photos. Check the result on a phone and with a keyboard. Verify that the gallery can close and that you can reach the controls. For movement, try the site with your system’s reduced motion preference. If a map is slow or unavailable, the address and directions should still help the visitor.
4. Publish the reviewed version
Compare your preview with the intended page and wait for a ready build. Publish the version you checked and repeat the same test on the public URL. The Agent’s saved website changes and the public version are separate until you publish.
Common problems
- Wrong pin. Check the street number and entrance. Give the Agent a more precise location.
- Unclear chart. Check the values, units, and labels against your source. Ask for a simpler chart or an accompanying table.
- Gallery controls are hard to reach. Describe the exact device or keyboard step that fails and check the next preview.
Frequently asked questions
Can I use a chart with my own figures?
Yes. Supply the actual values and labels and compare the preview with your source before publishing.
Should a location map replace the address on the page?
Keep the address and directions visible as text. Visitors can still use them if they cannot use the map.
Is a gallery the same as a slideshow?
A lightbox lets visitors open and browse larger photos. Ask for the behavior you need and check it in the preview.
Does asking the Agent to add an Extension publish it?
The Agent builds a working version for review. Choose Publish when you want the change to go live.