
How to read your website analytics
See how visitors find your website, which pages they use, and what to check next.
Frontpage Analytics shows recorded activity on your published website. Use it to answer a clear question, such as whether visitors can find your quote page and continue to your contact form.
This guide follows a home services business checking its quote page. The example is a task to try, not a claim about results from a real business. Start with the whole website, inspect one page, and choose one change you can check afterward.
Before you start
Select your website in the workspace and open Growth → Analytics. You need access to that site's workspace and a published site with recorded visits. You do not need to make a website edit to read the reports.
If the page says No visits in this period yet, choose a wider date range or check again after the published site receives traffic. Editor activity is not a reliable substitute for visits to the public website.
1. Choose a useful date range
Use 24h, 7d, 30d, or 90d at the top of Analytics. These presets cover a trailing period ending now. Start with 30d if you want a broad view, or 7d when reviewing a recent page change.
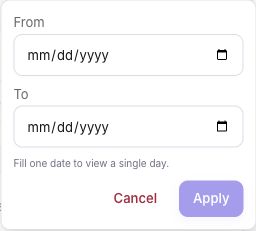
For a specific period, choose Custom dates. Fill From and To, then choose Apply. You can fill one date to view a single day. Custom date-only ranges use whole UTC days, which may not match midnight in your local time zone.
Where a percentage comparison appears, it compares the selected period with the previous period of the same length. A blank comparison may mean there was no earlier baseline. Check the underlying counts before deciding that a large percentage change matters.
2. Read the three traffic numbers
- Visitors: the distinct anonymous visitor identifiers recorded in the selected period.
- Sessions: recorded visits. One visitor can have several sessions.
- Pageviews: recorded page views. A visit can include several pages and repeat views.
These numbers answer different questions. More pageviews does not necessarily mean more customers. One person may browse several pages, return later, or use more than one device. Anonymous identifiers also change over time, so Visitors is not an exact count of named people.
In Website traffic, switch between Visitors, Sessions, and Pageviews to see the trend for that measure. Look for a sustained change rather than treating a single busy day as proof that an edit worked.
3. Check how visitors arrive
Under Acquisition, read Top sources and Referrers. Sources group arrivals, such as search, social, paid, or direct. Referrers show the websites reported as sending visitors.
Campaigns (UTM) shows visits from links that include campaign labels. It is not a list of your saved Frontpage email campaigns. If you share tagged links in an ad or email, use clear, consistent labels so you can recognize them later.
Click a source or referrer where the report offers filtering. Check the Filtered to: labels before comparing totals. Remove a filter with its close control, or choose Clear all when several filters are active.
Traffic source information depends on what the browser and link provide. Direct traffic does not prove that every visitor typed your address. A missing referrer or blocked tracking can limit what the report can show.
4. Inspect the page you want to improve
Use Search pages to find your quote page by name or address. Select it using the page controls. Check VIEWING to confirm whether you are looking at one page or All pages.
The page view shows its traffic and engagement. Read Sources in to see where its visitors came from and Where they went next to see the next recorded pages within their visits. Return to All pages for the website totals.
For the home services example, check whether people move from the service page to the quote page. Then inspect the quote page on a phone. A hard-to-find form, unclear service area, or broken button is a specific issue you can fix; a visitor leaving the page alone does not tell you why they left.
5. Use engagement and quality as clues
Entry pages show where visits begin. Exit pages show their last recorded page. Under Engagement, review Bounce rate, Avg. visit, Pages / visit, and Engaged visits.
A high exit rate is not always a problem. A visitor may find a phone number and call. Average visit time reflects recorded activity, not proof that someone read every word. Check the page's job before changing it.
Use Devices to compare mobile and desktop activity. Page speed, Scroll depth (sessions), and Frustration signals can help you decide what to inspect. Repeated clicks or JavaScript errors are reasons to check the affected page, not proof that every affected visit failed.
6. Check goals against actual business records
Where configured goals have recorded values, Revenue by goal appears. A goal is a tracked action, such as a form submission or purchase. The report only shows events and values that the website actually records.
Do not treat a click, requested appointment, or assigned goal value as a confirmed sale. Check form submissions, orders, or Payments for the underlying business result. Analytics helps you examine activity; it does not replace those records.
7. Make one change and review it later
Write down the page, date range, active filters, and issue you found. Ask the Agent for one clear edit, such as moving the quote form below the service description. Review and publish the website change, then give it enough visits to make a useful comparison.
Recheck a similar period with the same filters. Note other changes, such as a new ad or seasonal demand. A better number after an edit does not prove that the edit caused it.
Common problems
- Numbers look too small: check the selected page, date range, and active filters first.
- Another reporting tool differs: compare its dates, time zone, tracking rules, and definitions before comparing totals.
- A card is missing or empty: some reports need relevant recorded events. Do not assume a missing goal card means a payment failed.
Check your result: you can identify the period and page you reviewed, explain the difference between visits and pageviews, and name one website issue to inspect.
Frequently asked questions
What is the difference between visitors, sessions, and pageviews?
Visitors estimates how many people came to the site. Sessions counts visits, and pageviews counts page loads. One visitor can have several sessions and view several pages.
How should I compare website traffic between periods?
Use date ranges of the same length and check where the visitors came from. A change in traffic source can explain a change in the overall numbers.
Does an analytics goal prove I received a lead or order?
No. A tracked action is a useful clue. Check the form inbox, booking calendar, or order records to confirm what the customer actually submitted.